Introduction
When a project’s bottom line drifts even a few points off target, the ripple effect can cost a contractor more than just dollars—it can jeopardize future bids, strain client relationships, and sap team morale. That’s why the right cost‑control software isn’t just a nice‑to‑have; it’s a lever that can swing a 15 % savings margin from “nice hope” into “real result.” Below, we’ll walk through how the technology uncovers hidden overruns, and why those insights matter for every job site, big or small.
1. Unlock a 15 % Savings Boost: Why Cost Control Software Is a Game‑Changer for Construction Projects
- Visibility that traditional spreadsheets can’t provide.
A seasoned estimator will tell you that manual sheets hide the true cost trajectory until it’s too late. Digital cost‑control tools aggregate labor, material, and equipment data in real time, letting you see the budget health at a glance.
- Speed of decision‑making.
When a crew reports an unexpected material price increase, the software instantly recalculates the impact on the overall project. That immediacy turns what used to be a weekly “catch‑up” into a daily conversation, shaving days off the mitigation cycle.
- Consistent accountability.
By assigning every cost entry to a responsible user, the platform creates a paper‑trail that discourages “ghost” expenditures. Contractors who have adopted this practice report tighter discipline on site and fewer surprise invoices.
The bottom line? The combination of real‑time insight, rapid recalculations, and traceable ownership creates the conditions where a 15 % savings isn’t a vague promise—it’s a documented outcome that can be replicated across projects.
2. Pinpoint the Money Leaks: Real‑World Ways the Software Detects Hidden Overruns
- Variance alerts on labor productivity.
The system compares planned man‑hours to actual clock‑in data. If crews consistently exceed estimates by, say, 8 %, the platform flags the deviation and suggests a root‑cause analysis—often revealing inefficient sequencing or equipment downtime.
- Material waste tracking through barcode scans.
When subcontractors scan each delivery, the software logs quantity versus usage. A sudden surge in “unused” pallets triggers an alert, prompting the project manager to investigate over‑ordering or theft.
- Equipment idle time monitoring.
GPS‑enabled machines report active versus idle minutes. High idle percentages surface in the dashboard, signaling that a crane is sitting on the site longer than needed, which directly inflates rental costs.
- Change‑order impact modeling.
Instead of manually re‑budgeting each change, the tool runs a “what‑if” scenario the moment a change order is entered. You instantly see whether the added scope will erode your profit margin or if a cost‑saving alternative exists.
- Subcontractor performance benchmarks.
By aggregating past project data, the software highlights subcontractors whose actual costs routinely exceed their bids. This insight guides future contract negotiations and helps you price contingencies more accurately.
These detection mechanisms turn abstract “budget creep” into concrete, actionable signals—allowing you to plug leaks before they become costly floods.
3. Set Up for Success: Quick‑Start Steps to Deploy Cost Control Tools on Any Job Site
A tidy rollout is the difference between a software that gathers data and one that actually drives savings. Below is a lean‑nine‑step launch plan that works on a downtown high‑rise, a remote bridge, or a modest remodel.
- Define a single, measurable goal.
Pick a concrete metric—‑‑ for example, “reduce material waste by 5 % in the first 30 days.” When the goal is clear, every configuration choice (report templates, alert thresholds, user permissions) can be tied back to it.
- Map existing data sources.
List where labor hours, delivery receipts, and equipment logs live today—‑‑ whether on spreadsheets, handheld scanners, or legacy ERP modules. Most cost‑control platforms will ask you to upload a CSV or set up an API; knowing the source paths ahead of time prevents last‑minute scrambling.
- Create a “sandbox” pilot crew.
Choose a small, tech‑savvy team (foreman, scheduler, and a site accountant) to test the system on a single work package. This limited exposure lets you verify that barcode scans sync correctly, GPS machines report idle time, and change‑order scenarios compute as expected.
- Establish naming conventions.
Agree on consistent codes for trades, material SKUs, and cost‑centers. A disciplined approach—‑‑ think “ELEC‑001‑CABLE” instead of “electrical stuff”—makes later reporting a breeze and reduces the risk of duplicate entries that would otherwise skew forecasts.
- Configure alerts with realistic tolerances.
Set the platform to flag deviations that truly matter (e.g., a 10 % overrun on scheduled labor), not every minor variance. Over‑alerting breeds fatigue; a well‑tuned threshold keeps the team focused on genuine cost leaks.
- Integrate with complementary tools.
Link the cost‑control engine to your existing scheduling software and, if you run multiple projects, to project portfolio management tools. This connection lets you see how a delay on one job ripples through cash flow across the whole portfolio.
- Run a “data‑dry‑run” drill.
Simulate a change order, a material over‑delivery, and an equipment breakdown in the sandbox. Verify that each event triggers the correct dashboard updates and that the projected profit impact is displayed within seconds.
- Roll out site‑wide training.
Hold a short, hands‑on workshop for every crew member who will input data—‑‑ from the crane operator scanning the machine’s odometer to the foreman logging daily labor. Emphasize why the entry matters, not just how to click a button.
- Go live and monitor the first week.
Keep a project accountant on standby to answer questions, validate data integrity, and fine‑tune alert thresholds. The first seven days usually reveal any lingering synchronization glitches before they affect the budget.
By following this checklist you avoid the “set‑it‑and‑forget‑it” trap. The tool becomes an extension of the crew’s daily rhythm, and the early wins you capture—‑‑ like a 3 % drop in unused pallets—reinforce the habit of accurate data entry.
4. Turn Data Into Decisions: How Real‑Time Dashboards Slash Guesswork
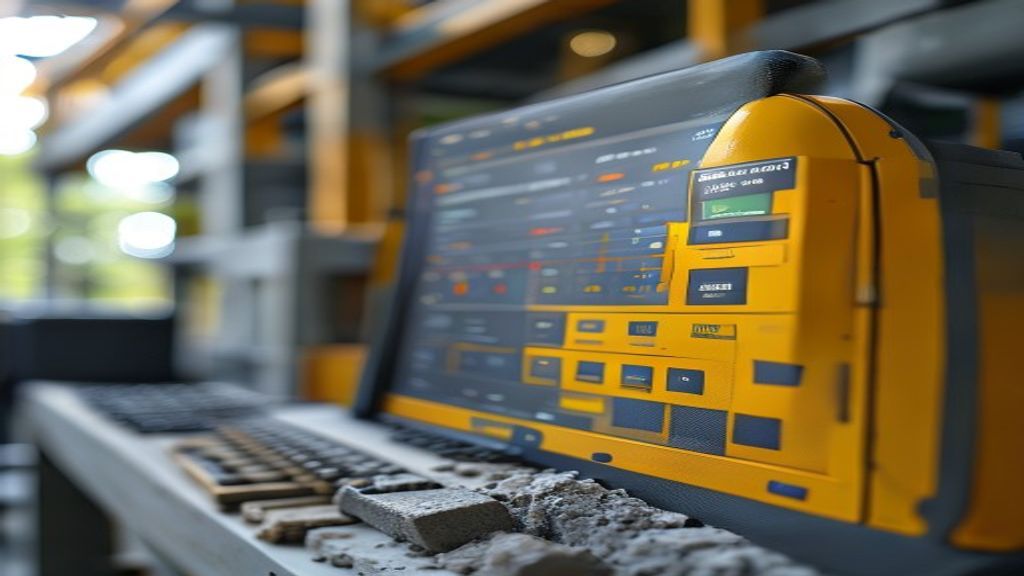
When the numbers appear on a screen the moment a crane idles or a delivery is scanned, intuition gives way to insight. A well‑crafted dashboard does three things: it tells you what happened, why it matters, and what to do next.
Visual hierarchy that guides the eye
Top‑level tiles show the most critical health indicators—‑‑ budget variance, labor productivity, and equipment utilization. A single red pulse on the “Equipment Idle Time” tile instantly signals that a costly asset is underused, prompting the scheduler to reassign the machine to a high‑need activity.
Drill‑down capability for root‑cause analysis
Clicking the labor‑productivity gauge opens a sub‑report that breaks down hours by trade, crew, and shift. If the electrical crew’s efficiency dips below the benchmark, the manager can compare yesterday’s crew list, weather conditions, and recent change orders to pinpoint the cause—‑‑ perhaps a new wiring code introduced an unexpected step.
Scenario modeling in real time
Because the platform processes change orders the instant they’re entered, you can slide a “what‑if” knob and watch profit margins swing. For instance, adding a waterproofing scope that costs $12 k may shave 2 % off the overall schedule; the dashboard instantly shows whether the schedule gain offsets the added expense, letting you decide to accept, negotiate, or reject the change.
Cross‑project context through project portfolio management tools
When you aggregate dashboards across several sites, patterns emerge: one subcontractor consistently inflates material costs, while another maintains tight labor ratios. Seeing this at the portfolio level informs strategic decisions—‑‑ you might consolidate purchases with the efficient vendor or apply stricter performance bonds to the outlier.
Mobile‑first design for on‑the‑ground action
Foremen can pull up the same dashboard on a tablet while standing on a concrete slab. A quick glance at the “Material Waste” chart reveals a spike in unused steel rebar; the crew can then halt the next shipment, saving both material and hauling fees.
Alert‑driven decision loops
Beyond visual cues, the system pushes push‑notifications when thresholds are breached. A sudden 15 % rise in “stock management software for small business”‑style inventory discrepancies triggers an email to the procurement lead, who can then verify whether a mis‑count or a theft is at play.
In practice, these real‑time dashboards turn raw data into a conversation starter rather than a report you file away. The project manager no longer asks, “Did we stay on budget?” and instead asks, “Which line‑item is pulling us off track, and how can we correct it today?” That shift from hindsight to proactive control is where the 15 % savings promise becomes a reality.
Also Read: Pick an Invoice Program for Small Business and Slash Billing Mistakes